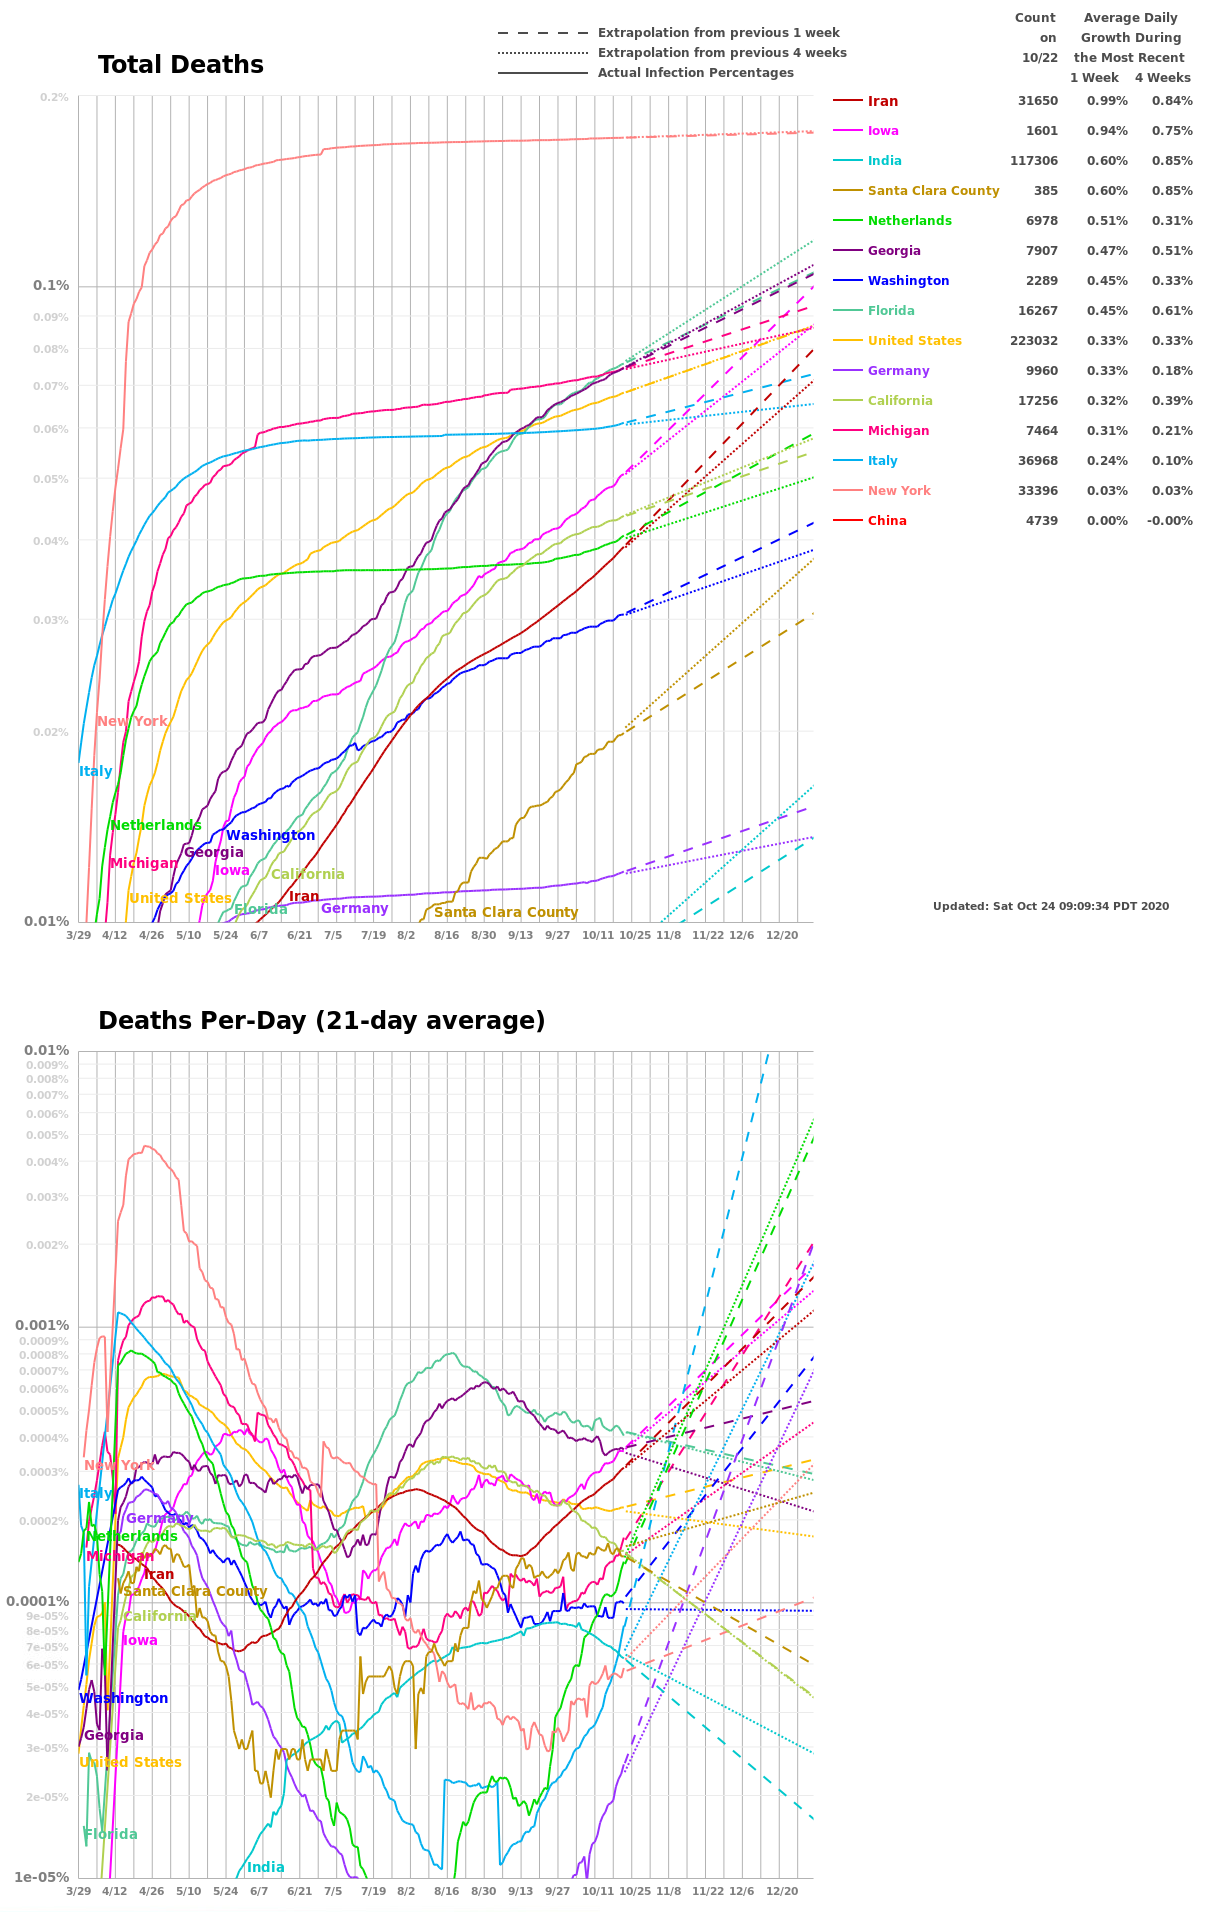
Deaths per day is a lagging indicator that is not influenced by the testing rate. I’m averaging the past 7 days to smooth noise, and to eliminate a pattern of higher values toward the end of the week.
Author Archives: Brent Gregory
Encouraging Antibody Results from LA
LA Public Health just released early results from their antibody testing suggesting that between 2.8% and 5.6% of the population has been infected. With 619 deaths, this implies a fatality rate between 0.41% and 0.28%. The influenza death rate is often quoted as 0.1%, but that comes from dividing the number of flu deaths (34 …
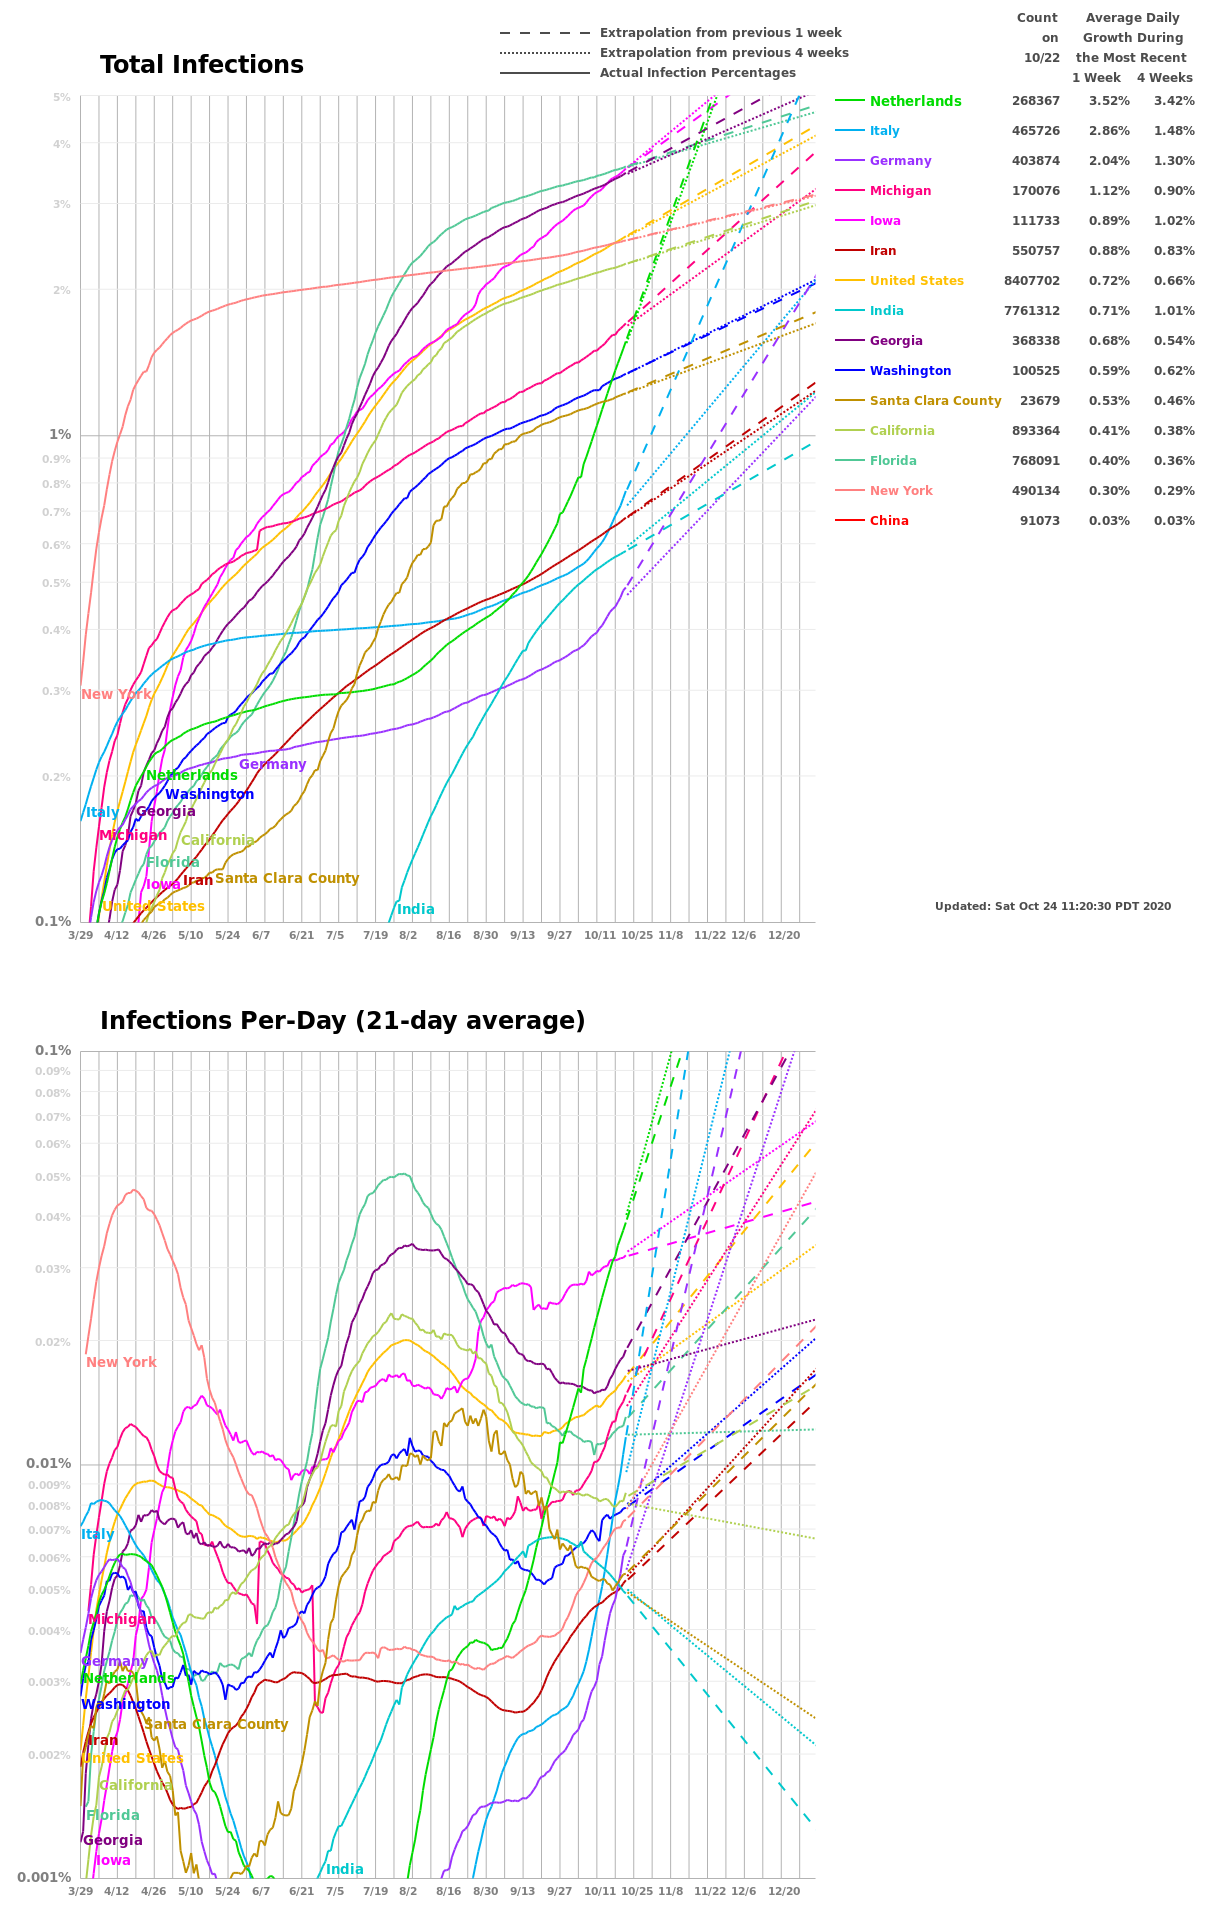
New Infections Per-Day
I added a new plot that shows the percent of the population that is newly infected every day. I take the average of the previous four days to smooth the curves. The per-day curves show that China’s second peak is starting to recede. Italy is past its first peak. Maybe Germany and the Netherlands and …
We’re seeing a nice Bend
We’re seeing a consistent and dramatic drop in the average daily growth rate everywhere I’m tracking, except India. The 1-week growth percentage numbers are all smaller than the 2-week numbers. The dashed lines all lie below the dotted lines. This is very good news. I suspect (hope) that the India increased growth rate is due …
Average Daily Growth
The table of “Average Daily Growth During the Most Recent 1 Week and 2 Weeks” gives the ratio of total confirmed infections on a day divided by the number from the previous day. For example, a 18.92% daily growth rate results in doubling every four days (1.1892 * 1.1892 * 1.1892 * 1.1892 = 2.0).
If I’m Infected, Will I Die?
The chance of dying from the infection depends on the ratio of fatalities to infections. We only know the ratio of fatalities to confirmed infections (around 2%). The number of unconfirmed infections is the big unknown. If many people are infected but have not been tested, then the ratio of fatalities to infections could be …
Understanding Log Plots

Where would you rather be? The Linear Plot suggests Region A is in worse shape. But, the Log Plot shows that Region B is likely to soon become much worse than Region A. The pandemic’s exponential growth rate is shown as the slope of the curve in the Log Plot. The Log Plot slope of …
US Infections Go Super-Exponential
The seven-day average number of days-to-double in the United States dropped to 2.03 from 2.36 a few days ago. The days-to-double keeps dropping, making the infection curve super-exponential. If each infected person sickens one additional person every two days, the total number infected would double every two days, and we’d have exponential growth. Super-exponential growth …
COVID-19 Percent Confirmed Infections as of October 23
Will I get Sick?

In the United States, the number of infected has been doubling every two days. With 20,000 infections and a population of 327 million, it will take 14 doublings before everyone has it: 20,000*2*2*2*2*2*2*2*2*2*2*2*2*2*2 = 327 million. At the current rate, this will happen in 14 * 2 = 28 days, and occur around April 19. …